Last year researchers from SARDI and Cesar Australia developed a predictive Russian wheat aphid calculator to help decide if spraying is economically justified. Here we explain the calculator and how to use it to assist with making control decisions.
Russian Wheat Aphid
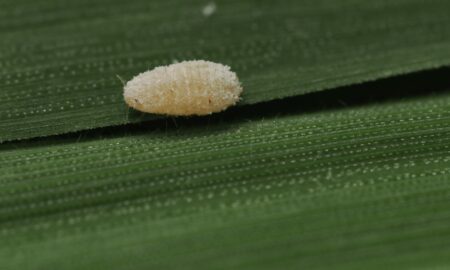
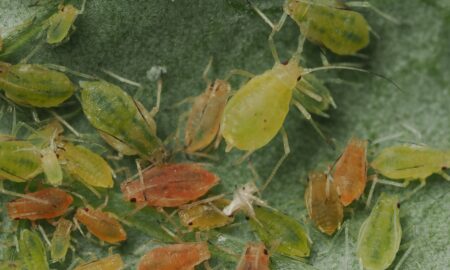
In south eastern Australia the Russian wheat aphid, Diuraphis noxia, is now widespread. Its lime green colour, elongate shape, very short antennae, apparent lack of siphunculi and feeding damage symptoms readily distinguish it from other pest aphids found in Australian cereal crops.
For further information on Russian wheat aphid identification see our pestbites episode.
What the calculator does
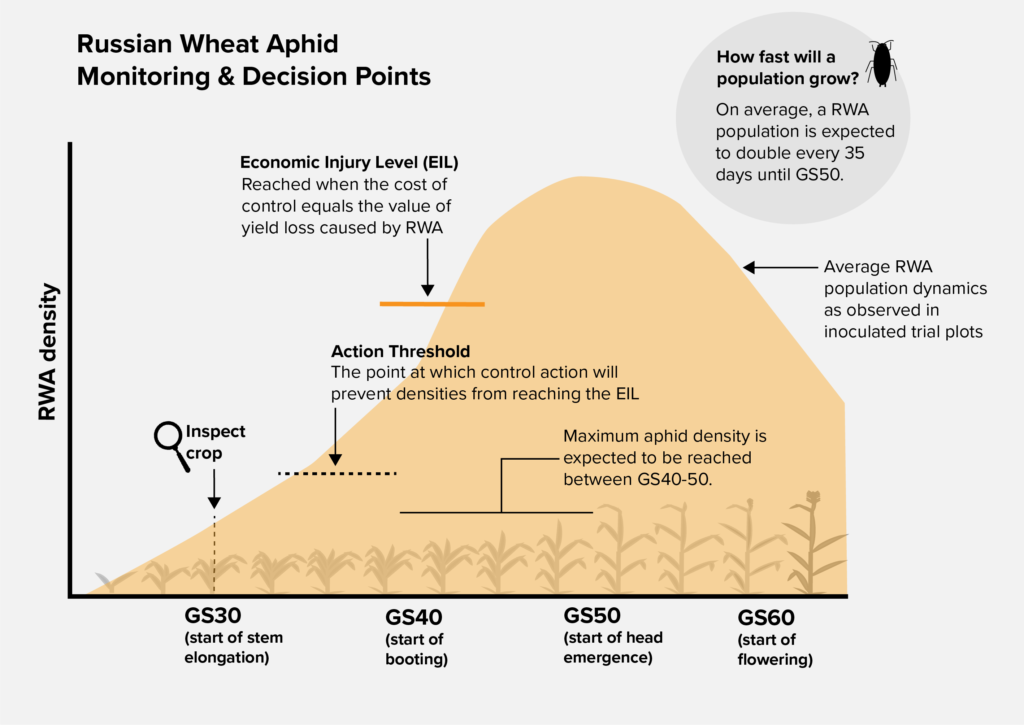
The predictive calculator uses economic and agronomic data inputs to calculate the action threshold at which control should be taken in order to prevent an increasing RWA population from reaching the economic injury level.
The calculator can be applied to winter and spring cereal varieties.
Economic Injury Level
The ‘Economic Injury Level’ determines when it becomes cost effective to undertake control measures. The economic injury level is reached when the cost of pest control equals the value of yield loss resulting from feeding damage. So, when pest densities are higher than the economic injury level, or if they are predicted to exceed the economic injury level, it is more economical to control the pest. When pest densities are lower, or are predicted to be lower, than the economic injury level, pest control would be more expensive than the cost of the yield lost.
Because crops are not always inspected immediately before pest control is undertaken, the calculator takes this delay into account and predicts the change in aphid pressure in the lead up to head emergence.
How to use the calculator
The calculator is used at GS30 (start of stem elongation) to determine the action threshold (the maximum percentage of tillers with Russian wheat aphid is usually reached between GS40 (start of booting) – GS50).
To use the calculator, you will need to have estimations for cost of control ($/Ha), cereal market price ($/t), yield potential (t/ha), and days until GS50 (start of head emergence). You will also need to input Russian wheat aphid abundance data (percentage of tillers with Russian wheat aphid), collected based on a standardised monitoring technique. Monitoring at GS30 will allow prediction of aphid density leading up to head emergence, and therefore if action is need during that time period.
How to monitor for Russian wheat aphid
The percentage of tillers with Russian wheat aphid are calculated by counting the number of tillers in 50 cm row lengths in at least 5 areas of the paddock and then counting the number of those tillers with symptoms. Then from the tillers with symptoms, 20 tillers in each of the 5 areas are checked for the presence of aphids. This will give the percentage of tillers with symptoms and Russian wheat aphid. Finally, this percentage is multiplied with the percentage of tillers with symptoms to give the overall percentage of tillers with Russian wheat aphid.
More details on this calculation and how to use the calculator are given in this instructions for use fact sheet.
Management considerations
The growth stage at which Russian wheat aphid establishes has a strong effect on yield loss potential. If establishment occurs after GS30 there is low aphid growth potential. Even when aphid establishment occurs at early growth stages, large yield losses can be mitigated through monitoring and timely control.
A control decision should be made based on Russian wheat aphid population densities between GS30 and GS50.
Predation and parasitism play an important role in controlling the aphid population growth rate, so keep an eye on natural enemies present in paddocks.
Wetter and cooler summers or early breaks will increase the risk of early season infestation by Russian wheat aphid in mainland grain growing areas. In low green bridge risk years (a dry, hot summer and autumn), infestations reaching economically damaging levels are unlikely.
More information on how green bridges affect Russian wheat aphid.
Acknowledgements
The research initiative that supported development of the calculator was a GRDC investment that sought to deliver information on Russian Wheat Aphid management for grain growers. This project was undertaken by the South Australian Research & Development Institute (SARDI) and Cesar Australia. Thank you to Dr Jess Lye for contributing to this article.
Cover image: Photo by Andrew Weeks, Cesar Australia